


Manufacturing • BI and Data Analytics


From strategy and consulting through custom development, integration, visualization, and ongoing support, we deliver a complete spectrum of reporting and dashboard development services tailored to your data landscape, your teams, and your business objectives.

Successful reporting initiatives begin with a clear understanding of business goals, data sources, and user requirements, tied closely to our broader bi and data analytics practice. We assess existing reporting environments, design dashboard roadmaps, and recommend the right technologies to create data experiences that deliver measurable business value. We assess existing reporting environments, design dashboard roadmaps, and recommend the right technologies to create data experiences that deliver measurable business value while supporting long-term growth and scalability.

Every organization has unique reporting requirements that standard reports often fail to address. Our custom report development services enable businesses to transform complex operational and analytical data into meaningful reports tailored to specific teams, departments, and business objectives. By integrating data from multiple systems and automating report generation, we help organizations improve visibility, streamline decision-making, and ensure stakeholders have access to accurate and actionable insights when they need them.

We deliver modern business intelligence dashboard development solutions that provide decision-makers with a centralized view of business performance across functions and departments. Our dashboards consolidate data from multiple enterprise applications, enabling users to monitor trends, analyze performance metrics, and identify opportunities for improvement. Designed for executives, managers, and operational teams, these dashboards support faster, data-driven decisions through intuitive access to trusted business information.

Data becomes more valuable when it is easy to interpret and act upon. Our data visualization services focus on transforming complex datasets into intuitive visual experiences that improve understanding and accelerate decision-making. We design user-centric dashboards, visual analytics interfaces, and interactive reporting environments that highlight critical business insights while improving accessibility, engagement, and usability for stakeholders across the organization.
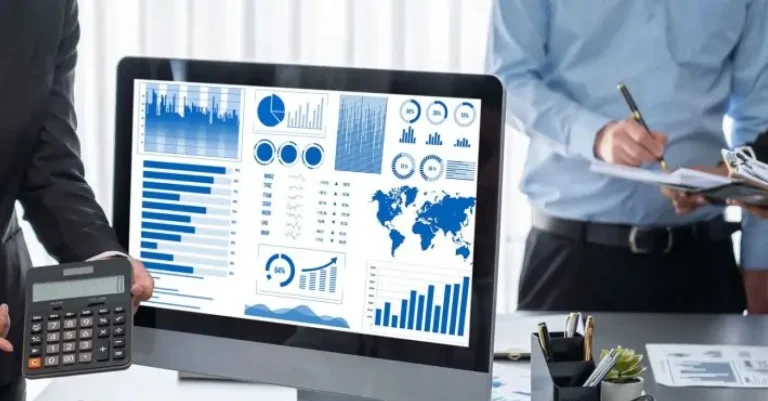

Enterprise reporting and dashboard environments require genuine domain knowledge of the metrics, systems, and decision-making processes specific to each industry. We bring sector-specific expertise to every custom dashboard development services engagement, ensuring dashboards, data models, and reporting solutions reflect the realities of your business.
 Healthcare and Life Sciences
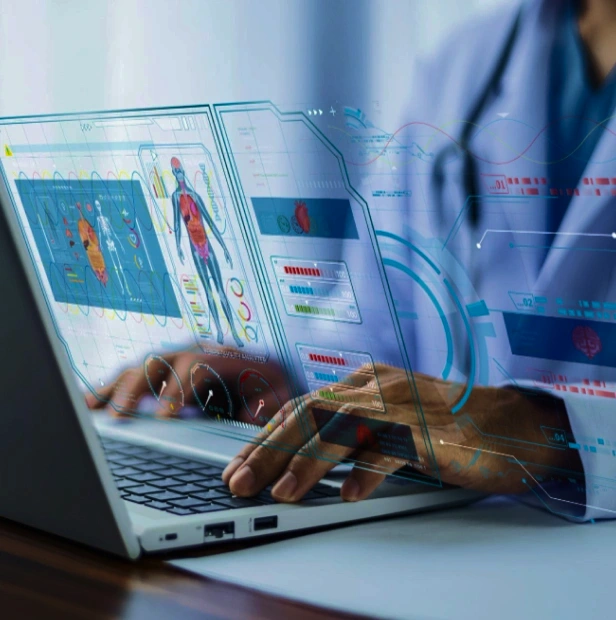
Operational and clinical performance dashboards, patient flow analytics, financial and reimbursement reporting, and quality and compliance scorecards built on consolidated data sources.
 Financial Services and Insurance
Regulatory and management reporting dashboards, risk and performance KPI monitoring dashboard solutions, and customer profitability analytics, built by our dedicated financial software development team.

 Retail and E-Commerce
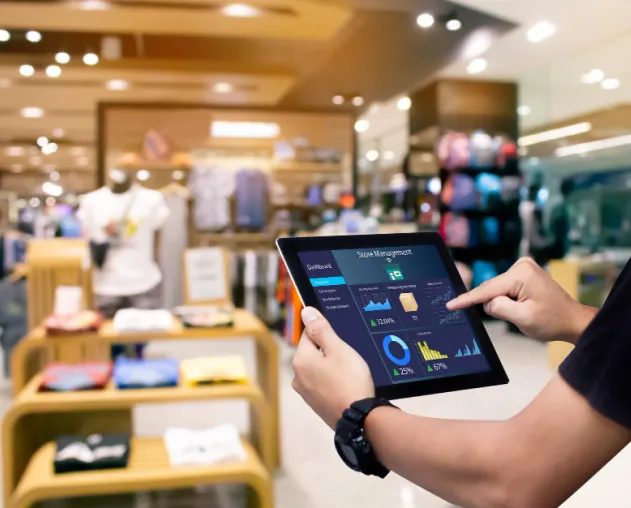
Sales and merchandising dashboards, inventory and supply chain reporting, customer analytics, and real-time reporting solutions providing performance visibility across stores and digital channels.
 Manufacturing and Industrial
Production performance dashboards, quality and yield reporting, supply chain and procurement analytics, and plant-level KPI scorecards are consolidated across multiple sites.

 Logistics and Supply Chain
Shipment and fleet performance dashboards, carrier and cost analytics, warehouse and inventory reporting, and demand forecasting visualizations.
 Government and Public Sector
Citizen service performance dashboards, budget and programme reporting, cross-agency data consolidation, and analytics platforms supporting public accountability reporting.

 Energy and Utilities
Asset performance dashboards, operational efficiency reporting, consumption and billing analytics, and compliance and safety reporting are built on integrated operational data sources.

Our reporting and dashboard engineering team combines deep expertise across visualization platforms, data integration, custom development, cloud analytics, and platform administration delivering reliable, scalable, and insight-rich reporting environments across the full enterprise technology stack.


Power BI, Tableau, Qlik Sense, Looker, SAP Business Objects, custom dashboard development frameworks, KPI monitoring dashboard tooling, and self-service analytics and reporting platforms.


Snowflake, Azure Synapse Analytics, AWS Redshift, Google BigQuery, SQL Server, Azure Data Factory, dbt, Informatica, and SSIS-based ETL frameworks.


Bespoke custom reporting software, embedded analytics, role-based reporting environments, parameterized report engines, and automated report generation and distribution pipelines.


AWS, Azure, and Google Cloud Platform native analytics services, REST and OData APIs, ERP and CRM connectors, and enterprise application integration frameworks.


SQL, Python, R, DAX, MDX, Power Query, predictive and statistical analytics frameworks, and automated reporting scripts for advanced business performance analysis.


Dashboard governance, capacity management, access control administration, performance tuning, and ongoing report and dashboard maintenance and optimization.
We deliver secure, scalable, and business-aligned reporting solutions tailored to evolving organizational needs. From strategy and implementation to ongoing optimization, we ensure every reporting and dashboard initiative drives long-term value and adoption.
Years of Engineering Experience
Projects Deployed to Production
Global Clients Across 21 Countries
Offices Across the Globe
We follow a structured six-phase methodology refined across 25+ years of enterprise software and analytics delivery and designed to address the specific failure modes of reporting programs: inconsistent metrics, low adoption, fragmented data sources, and under-governed platforms.
PHASE 01
PHASE 02

PHASE 03
PHASE 04

PHASE 05

PHASE 06
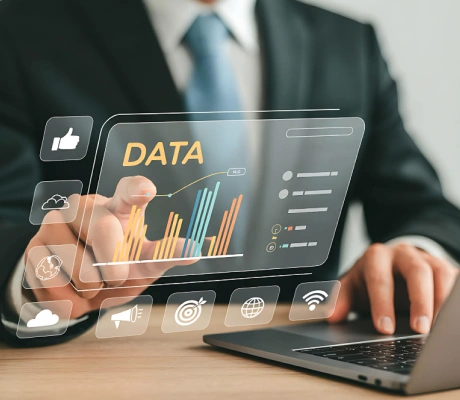
Unify fragmented data into custom reports and interactive dashboards that provide real-time visibility, improve operational efficiency, and empower teams with actionable insights.
Reporting and dashboard development services cover strategy, data integration, custom development, and optimization, delivered within our broader custom software development services practice.
Custom dashboards replace fragmented reports with a centralized, automatically updated view tailored to each team's specific KPIs, reducing time from question to insight.
Benefits include faster decision-making, improved data consistency through centralized reporting, reduced manual effort through automation, and greater accountability via transparent KPI monitoring.
Reports are structured, scheduled documents for a specific purpose; dashboards are interactive, near-real-time environments for ongoing performance monitoring. Most organizations use both.
Cost depends on data complexity, source systems, and reporting scope. Focused engagements are clearly scoped; broader enterprise programmes are larger, phased investments.
A dashboard development company builds custom, tailored environments; a BI vendor sells the underlying platform. We deliver business intelligence services across every leading platform.
Yes. We connect dashboards to SAP, Salesforce, Oracle, Workday, and Dynamics, including SCADA and MES systems for our clients.
We provide ongoing platform monitoring, performance optimization, data model updates, and user training, structured as time-and-materials, managed service, or dedicated optimization.

What Happens Next?
 100% Confidential. NDA available on request.Response within 4 business hours.No obligation to get started.
Share Your Requirements

Your information is secure and never shared with third parties.

Thank You!
We will contact you within four business hours. In the meantime, feel free to explore our case studies or read our latest Insights.


